Seltrax
Analytics

Know Your Numbers,
Not Just Your Orders

Sales, sessions, conversion and average order — and the numbers generic analytics never show a COD store: how many orders were actually delivered, which cities refuse parcels, and how much cash is still with the courier. Built in, on every plan, on your phone too.

Apna Store

Overview

Total sales

Rs 422.8K

+92.3% vs prev

Sessions

4,800

+51.5% vs prev

Conversion

6.3%

+56.3% vs prev

Avg. order

Rs 1,400

+1.0% vs prev

Total sales

Mon · Rs 56,258

TueWedThuFriSatSunMon

Conversion funnel

  • Sessions4,800
  • Viewed a product2,20846%
  • Added to cart71632%
  • Reached checkout44462%
  • Placed order30268%
  • Delivered26086%

The funnel doesn't stop at “placed order” — for COD, the sale only counts once it's delivered.

302 orders · 7 days

CityOrdersSalesDeliveredReturn rate
Karachi94Rs 131.6K90%
10%
Lahore82Rs 114.8K89%
11%
Islamabad36Rs 50,40092%
8%
Faisalabad27Rs 37,80081%
19%
Multan24Rs 33,60078%
22%
Peshawar21Rs 29,40074%
26%

Sample data. Switch the range, hover the chart, and flip between city, courier and product breakdowns.

The numbers generic analytics missMetrics Built for Cash on Delivery

Google Analytics sees a thank-you page and calls it a sale. For a COD store, that's where the risk starts. Seltrax follows every order to the door and the cash to your account.

Delivered rate

Orders actually delivered ÷ orders placed. The number that tells you what you really sold.

Return (RTO) rate

Parcels refused or undeliverable — by city, courier, product and customer.

Cash with couriers

Collected at the door but not yet remitted to you, per courier, right now.

Days to deliver

Average time from dispatch to delivery for each courier and city.

Confirmation rate

How many new orders confirm — and how many would have been fake shipments.

Delivered revenue

Sales counted on delivery, not on order — so returns don't inflate your month.

In depthEvery Report, Included

Sales

Revenue, the way you'd count it

Placed, confirmed and delivered sales side by side, so a big day of orders and a big day of revenue aren't confused.

Totals
Placed · confirmed · delivered
Breakdown
Day · week · month
Average order
By period, city, channel
Discounts
Given, by code
Fees
Delivery & COD fees collected
Compare
vs previous period

Traffic & conversion

Where visitors drop off

Sessions to delivered orders, step by step, with the pages and sources behind each drop.

Funnel
Session → product → cart → checkout → order → delivered
Sources
Direct · social · search · ads · referral
Devices
Mobile · desktop · tablet
Top pages
Views and exits
Checkout
Drop-off by step

Products

What sells, what comes back

Best-sellers by units and revenue — and the products with the highest return rate, before they cost you more.

Top products
Units · revenue · views
Variants
Best sizes and colours
Return rate
Per product
Stock
Low stock & days of cover
Collections
Performance per collection

Delivery & cash

Couriers, cities and money in transit

Which courier delivers fastest, which city refuses most, and how much cash each courier is still holding.

Delivered / RTO
By courier, city, product
Days to deliver
By courier and city
Cash with courier
Outstanding per courier
Remittances
Received and matched
Charges
Delivery & return costs

Customers

Who buys again

New versus returning customers, lifetime value, and the customers whose refusals are costing you.

New vs returning
Orders & revenue
Repeat rate
Customers with 2+ orders
Lifetime value
Average and top customers
Refusers
Customers with returns
Cities
Where your customers are

Marketing

What your ads actually delivered

Tie campaigns and discount codes to delivered revenue, not just clicks and placed orders.

UTM campaigns
Orders & delivered revenue
Discount codes
Uses and revenue
Facebook Pixel
Events sent automatically
Google Analytics
Connected in settings
Microsoft Clarity
Session recordings & heatmaps

Seltrax for Android

The same numbers, in your pocket

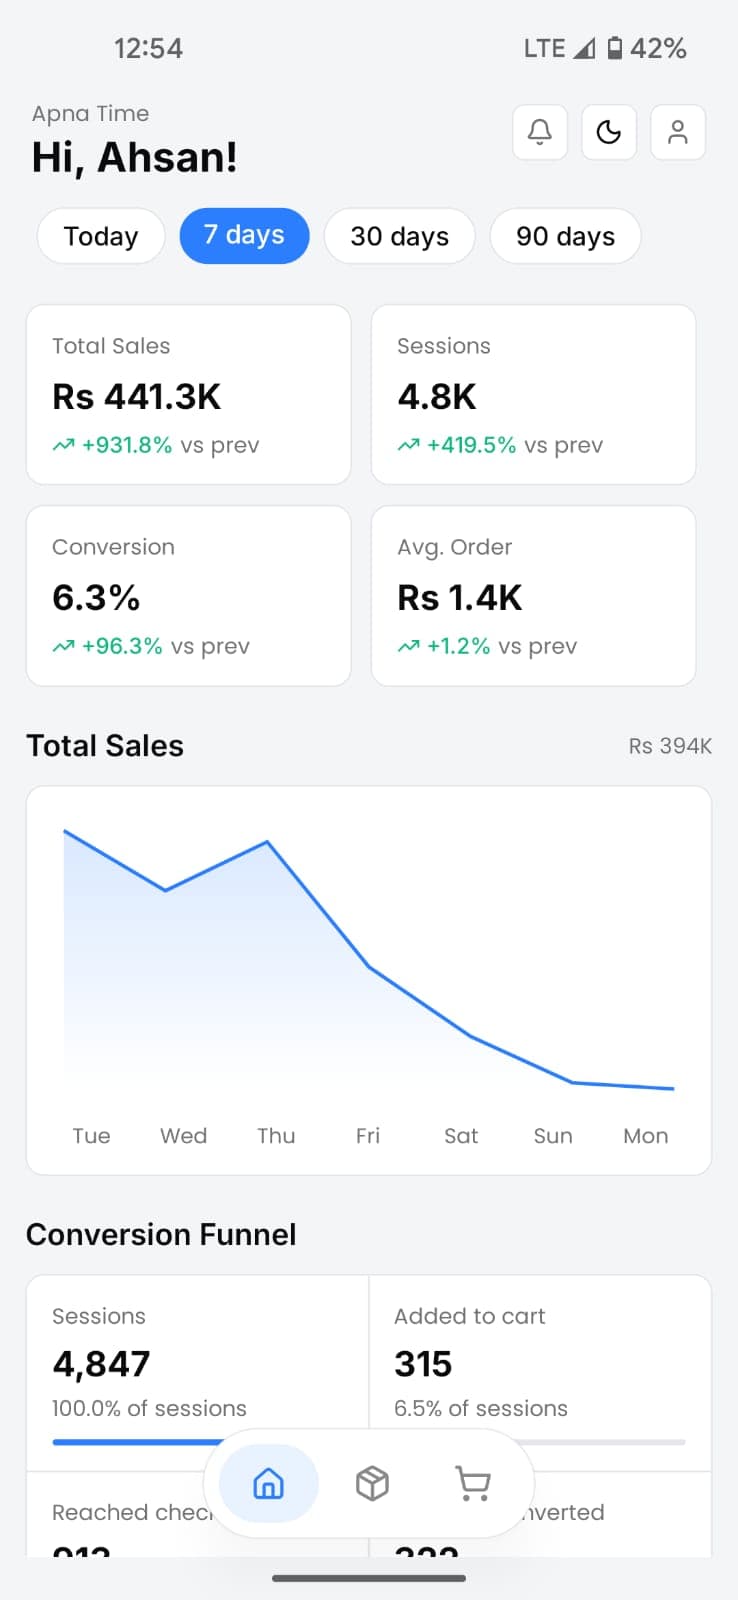
Total sales, sessions, conversion, average order and the funnel — for today, 7, 30 or 90 days — on the mobile app, exactly as they are on the dashboard.

Seltrax analytics on the Android app

Spec sheetAnalytics, Itemised

Core KPIsTotal sales · sessions · conversion · average order
RangesToday · 7 · 30 · 90 days, custom range, vs previous period
FunnelSession → product → cart → checkout → order → delivered
COD metricsDelivered rate, RTO rate, cash with couriers, days to deliver
BreakdownsCity · courier · product · variant · source · device
CustomersNew vs returning, repeat rate, lifetime value
MarketingUTM campaigns, discount codes
IntegrationsFacebook Pixel · Google Analytics · Microsoft Clarity
MobileDashboard in the Android app
AccessPer-person: hide revenue from staff
ExportCSV of any report
PriceIncluded — no analytics app to buy

Side by sideAnalytics on Seltrax vs Elsewhere

AnalyticsSeltraxShopifyWooCommerce
Sales, sessions, conversion & AOV built in
Funnel through to delivered orders
Return (RTO) rate by city & courier
Cash still with couriers
Courier delivery-time comparison
Full reports on every plan
Same dashboard in a mobile app
No analytics plugin or app to install

QuestionsAbout Analytics

  • Not for store performance — sales, sessions, conversion, products, couriers and cash are all in Seltrax. If you use GA, Facebook Pixel or Microsoft Clarity for marketing, connect them in settings and they run alongside.

Get started

Your store could be live tonight

Sign up, pick a theme, add your products — most sellers launch in under an hour. Rs 1,349/month, everything included, cancel anytime.

Create your store